August 2025 Vol. 80 No. 8
Features
Put the money where the pipe is: Optimizing wastewater pipeline rehabilitation projects
By Michael Persyn, PE, Lochner
(UI) — The 2025 Infrastructure Report Card by the America Society of Civil Engineers estimates a funding gap of $69 billion per year for capital improvements in the nation’s wastewater, drinking water and stormwater systems, with a projected increase to $690 billion per year if the systems continue along the same path.
Meanwhile, wastewater infrastructure continues to age, leading to increased incidences of failures and sanitary sewer overflows (SSOs). These funding limitations and aging infrastructure put tremendous pressure on utility owners to spend their limited resources as efficiently as possible.
Typical process
As part of a Capacity, Maintenance, Operations and Management (CMOM) program, utility owners typically target their worst condition wastewater pipes for rehabilitation or replacement, focusing on those pipes most likely to fail to avoid potential SSOs and minimize disruption to residents. Under the typical process, a study area is defined based on incidences of SSOs, maintenance reports, and/or infiltration and inflow observed from metered data. Condition assessments are performed on pipelines within the study area using CCTV to view pipes from inside and check for damage or degradation.
Pipe segments are typically graded using a rating system such as the Pipeline Assessment Certification Program (PACP) created by the National Association of Sewer Service Companies (NASSCO). The PACP system can be very detailed, but it can generally be summarized as ranking each wastewater pipe segment on a scale of 1 to 5. Grade 5 pipelines have failed or will fail within five years. Grade 4 and Grade 3 pipelines are in slightly better condition with potential failure within 5-10 years and 10-20 years, respectively. Due to funding constraints, typically only the highest priority segments are targeted for replacement or rehabilitation. Based on the pipe condition, a rehabilitation or replacement methodology is proposed for each of the highest priority segments.

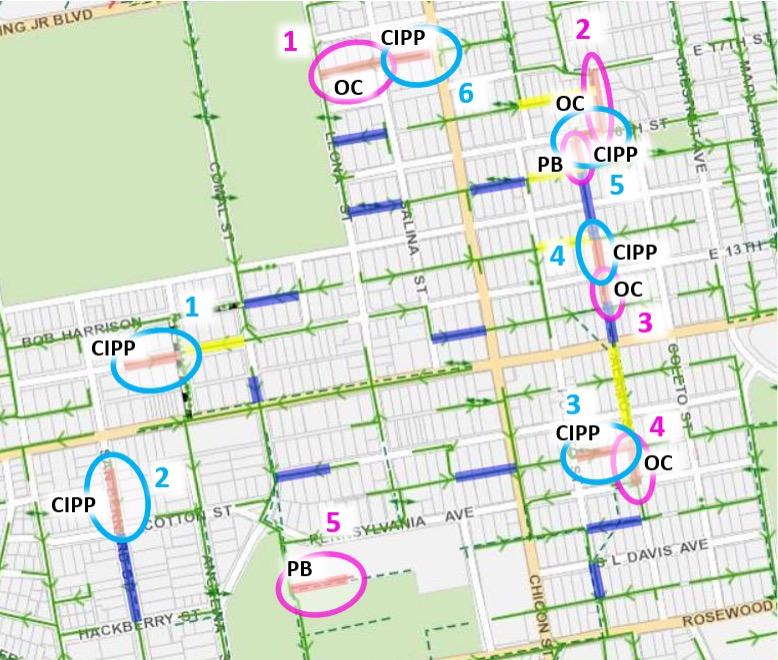
Figure 1: After CCTV review, rehabilitation methods are initially proposed for high-priority pipe segments (circled) based on the condition of the individual segments using a combination of methods. Blue and yellow segments represent Grade 1-3 segments and are not initially slated for rehabilitation with the project.
As shown in Figure 1, the process may identify numerous priority pipe segments scattered across the focus area, and each of these may require rehabilitation by one or a combination of three typical methods:
- Cured-in-place pipe (CIPP) lining, where a resin-coated liner is inserted into the existing pipe and then cured to form a seamless lining;
- Pipebursting (PB), where a bursting tool is run through the existing pipe to break it apart while pulling a new pipe directly into the host pipe; and
- Open cut (OC), excavation of a trench from the surface to directly access the pipe.
Each method has different use cases based on the pipe condition and require different equipment and labor, requiring specialized contractors to be employed for each, so the work is often divided into multiple bid packages. Combined with the multiple work areas, this results in duplication of costs, effort and local impacts – separate mobilizations, traffic control measures, bypass pumping setups and permits all increase the administrative and labor burden of a rehabilitation effort while increasing disruptions to residents and businesses.
A better way
Utility owners and engineers can realize greater efficiencies in rehabilitation efforts through key improvements to the typical process, putting more money toward the pipelines themselves. The first approach is by carefully crafting bid packages to reduce those duplicate construction and administrative costs. The second is by creating packages that fully understand the contractor’s costs in constructing projects in order to maximize the contractor’s efficiency.
The process for creating optimal bid packages begins with the initial pipeline assessment and analysis, well before the bid package is assembled. The typical process identifies a specific rehabilitation methodology per pipe segment. Field investigations reveal important surrounding considerations, including the presence of nearby utilities, traffic density, optimal or required location for bypass suction/discharge, and pavement restoration requirements. Engineers should consider adjacent pipe segments as part of the bigger picture and perform a cost/benefit analysis to try and reduce the mixture of rehabilitation technologies.
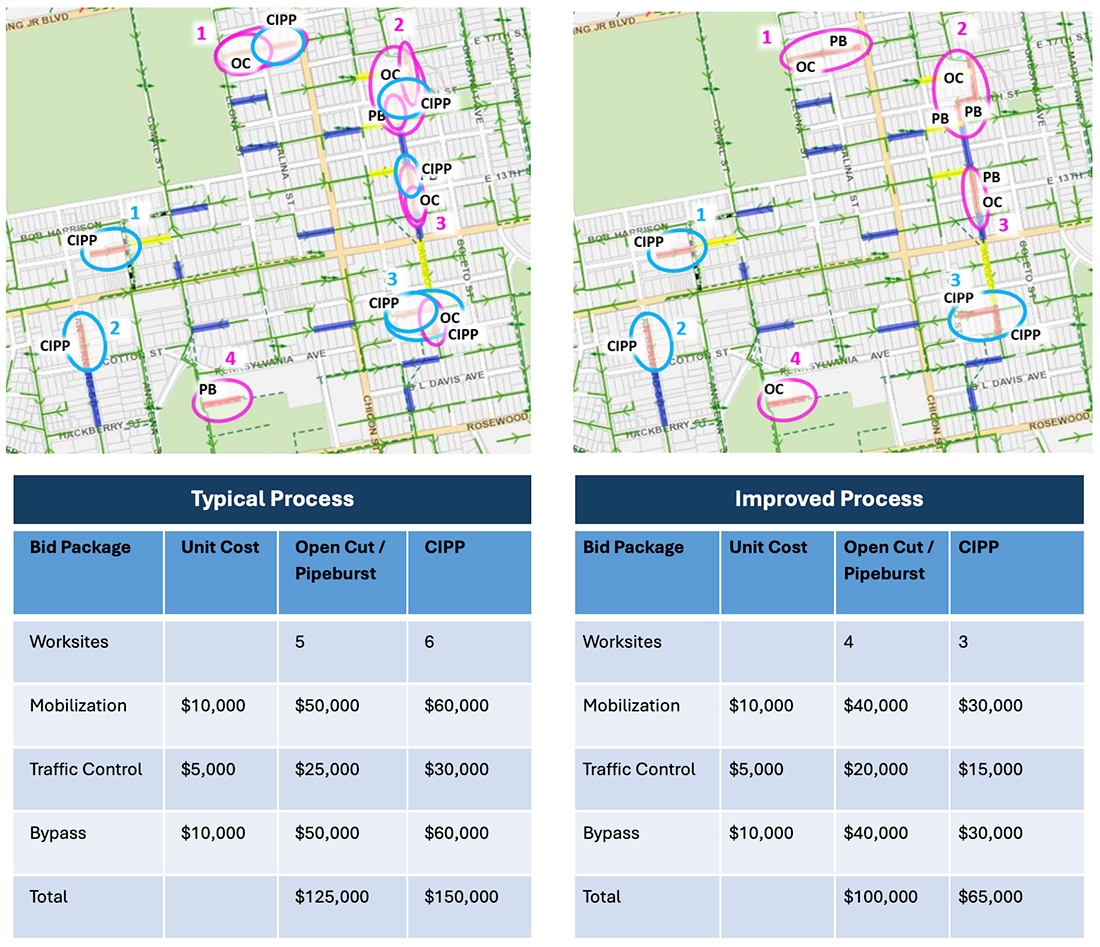
Consider adjacent pipe segments on the small diameter mains shown in Figure 2. At Location 1, one segment is an ideal candidate for CIPP with a few point repairs, while the other segment requires pipebursting. A cost/benefit analysis will show if converting the CIPP segment to pipebursting and doing both segments as a single project, even with additional pavement restoration that comes with pipebursting insertion pits and service reconnections, will be more or less expensive than bidding as a separate project with duplicated traffic control, bypass and overhead costs.
Reducing the mixture of technologies needed to rehabilitate adjacent pipe segments reduces the need for separate contractors, worksites and equipment. In Figure 2, the image to the left demonstrates the recommended rehab methodology based on the individual segment. The figure on the right illustrates a revised recommendation following cost/benefit analysis. The tables below that show how utilizing the same technology on adjacent segments reduces the number of worksites from 11 to 7, reducing the duplication of costs for mobilization, traffic control and bypass pumping.

Figure 2: Typical process (left) vs. improved process (right).
The second area for improvement involves understanding how contractors determine their labor costs. All projects have an optimal potential installation efficiency based on the site constraints, but this is especially prevalent for trenchless construction. It is more cost effective to rehabilitate more feet of pipeline at once than it is to rehabilitate short, discrete segments. In pipebursting, contractors look at their production rate on an average amount burst per week. The closer that you can get to optimizing that average, the lower the unit cost for the pipebursting will be.
In cases where CIPP lining is employed, longer CIPP shot lengths improve the installation efficiency and reduce the unit cost of the liner. The timeline for installation of a 300-foot segment of pipeline is not all that different than the timeline for an 800-foot segment.
There are some minor differences in installation and cool down time, but they still result in the same number of crew days charged for the job because the crew cannot be sent to another task that same day. Increasing the average shot length, or average installation length per setup, will increase labor efficiency and lower the unit cost of the installed pipeline.
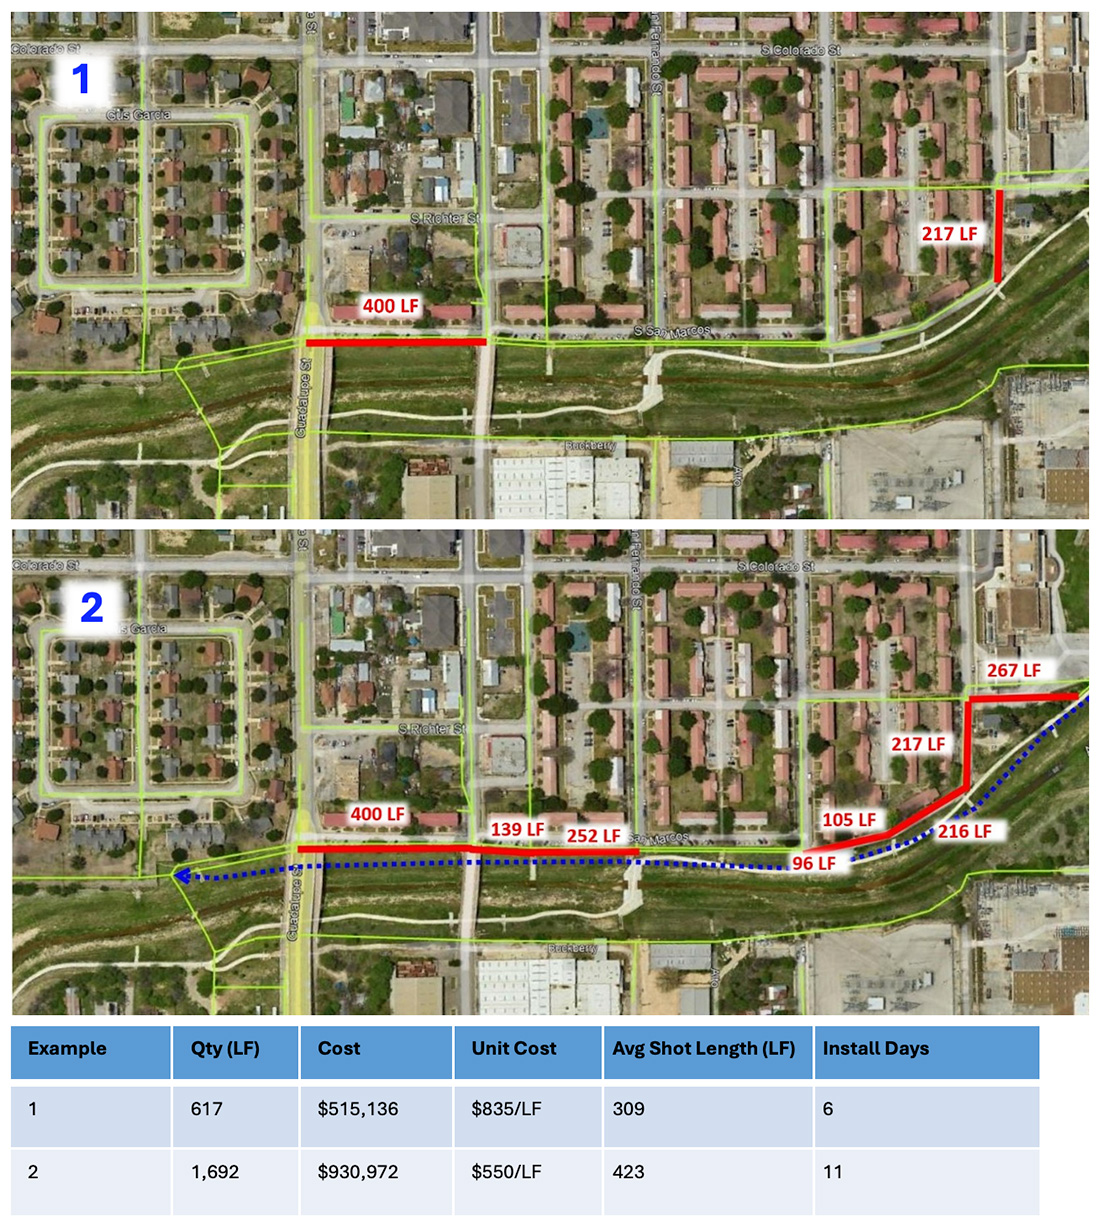
Figure 3 demonstrates a real-world example where additional footage of poor condition pipe was added to the project scope, resulting in significant cost savings. Additional cost savings are realized through the avoidance of future bypass costs associated with rehabilitating the gap segments as well as inefficiencies with those short segments.

Figure 3: The initial approach in Example 1 was to rehabilitate two discrete segments totaling 617 linear feet (LF). Adding the additional 1,075 LF in between the two segments in Example 2 resulted in the rehabilitation of 274 percent more pipe for just a 181 percent increase in cost – a 52 percent increase in efficiency.
Implementation of the two techniques demonstrated can reduce the duplication of costs and maximize contractor efficiency, putting more money into the infrastructure assets and maximizing the public investment.
ABOUT THE AUTHOR: Michael Persyn, PE, is the Water Business Practice Lead for K-Friese and Associates, a Lochner Company. He is based in San Antonio, Texas.


Comments