
Underground Natural Gas Storage Reaches Near-Record Withdraws
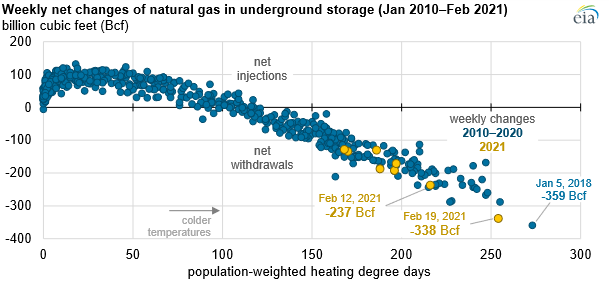
Significant demand for natural gas in mid-February led to the second-largest reported withdrawal of natural gas from storage in the United States, according to the U.S. Energy Information Administration’s (EIA) Weekly Natural Gas Storage Report (WNGSR). Weekly stocks fell by 338 billion cubic feet (Bcf) in the week ending Feb. 19, nearly three times the average withdrawal for mid-February. A record amount of natural gas, 156 Bcf, was withdrawn during that week in the South Central region, which includes Texas.
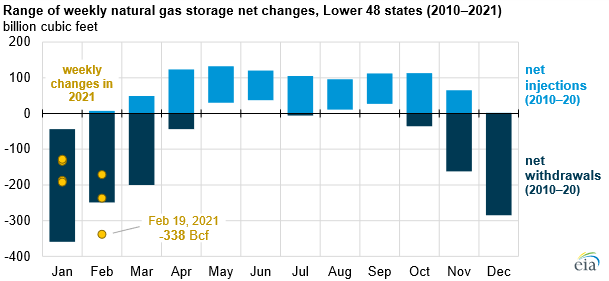
Colder-than-normal temperatures across much of the Lower 48 states, especially in Texas, led to increased demand for space heating. Population-weighted heating degree days (HDDs) represent temperature deviations lower than 65 degrees Fahrenheit and are weighted based on population distributions across the country. For the week ending Feb. 19, U.S. HDDs reached 254, or nearly 40% colder than normal, according to the National Oceanic and Atmospheric Administration.
In Texas, the two most common space heating fuels are electricity (the primary heating fuel in more than 60% of Texas homes, according to Census data) and natural gas (36%). Increases in electricity demand also affect natural gas demand because natural gas is the most prevalent electricity generation source in Texas and in much of the South.
Estimated U.S. natural gas demand on Feb. 14 reached 148.3 Bcf, surpassing the previous single-day record set in January 2019, according to estimates from IHS Markit. In addition, during the week ending February 19, U.S. average weekly dry natural gas production fell by 13.8 billion cubic feet per day (Bcf/d), according to estimates from IHS Markit. The decline in natural gas production was primarily because of freeze-offs, which occur when water and other liquids freeze at the wellhead or in natural gas gathering lines near production activities. Dry natural gas production fell by an estimated 10 Bcf/d in Texas alone, according to IHS Markit estimates.
Information in EIA’s Weekly Natural Gas Storage Report is also available on the Natural Gas Storage Dashboard, which shows natural gas inventories, storage capacity, prices, and consumption.
Related News
From Archive

- EIA: Texas to lead U.S. pipeline construction activity through 2027
- Oil pipeline struck during fiber optic construction spills into L.A. storm drains
- Utility strike at center of Dallas explosion investigation
- Gas line strike destroys three homes in Ohio neighborhood
- $1 billion Ohio River Tunnel project awarded in Pittsburgh
Comments